Gain Insights from Your Data Through Visual Representation
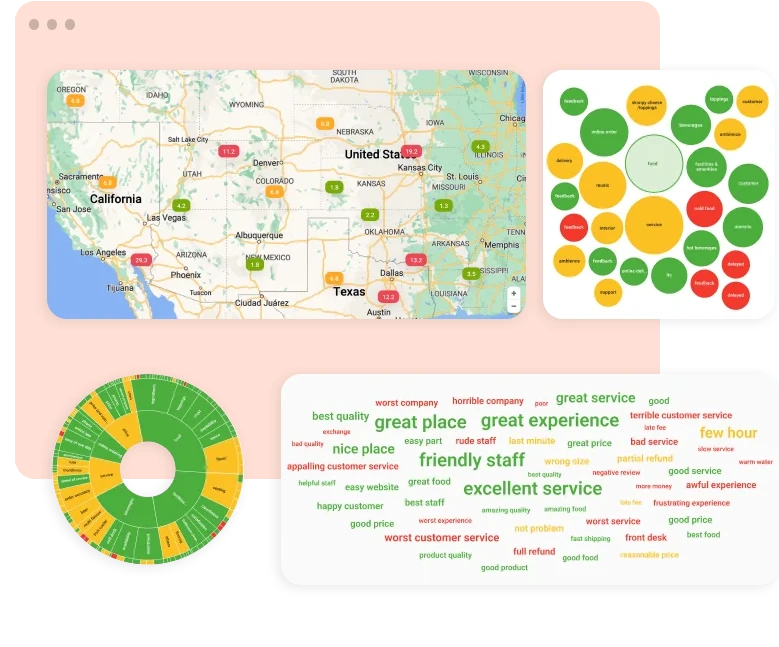
Unlock the full potential of your data with Maverick Insights AI’s Interactive Visuals, a powerful tool designed to transform complex information into clear, digestible insights. In today’s fast-paced business world, making quick, data-driven decisions is essential for success. With interactive visuals, you can quickly grasp key metrics, track trends, and uncover valuable patterns, allowing you to make smarter and more confident strategic decisions.
Transform Complex Data into Clear, Actionable Insights
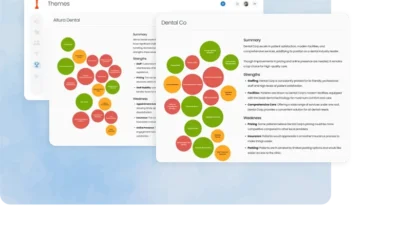
Data is only valuable when it’s actionable. Maverick Insights AI’s Interactive Visuals simplify complex datasets into easily understandable charts, graphs, and dashboards that clearly highlight important trends, performance metrics, and growth opportunities. By visualizing your data, you can uncover patterns that might be hidden within raw numbers, helping you make informed decisions faster and with greater precision. Whether you’re tracking customer sentiment, sales performance, or marketing effectiveness, these visuals bring clarity to your analysis and provide immediate insights that would otherwise take longer to identify through traditional data analysis methods.
Understand Key Metrics at a Glance
One of the greatest benefits of interactive visuals is the ability to access key performance metrics in a single view. With interactive dashboards, you can see all of your critical data points—such as customer reviews, engagement rates, and social media performance—in one place, with the ability to drill down into specific details as needed. This bird’s-eye view gives you a clearer picture of your business health, enabling you to spot trends and make adjustments in real-time without feeling overwhelmed by endless spreadsheets or numbers.
Track Trends and Uncover Opportunities for Growth
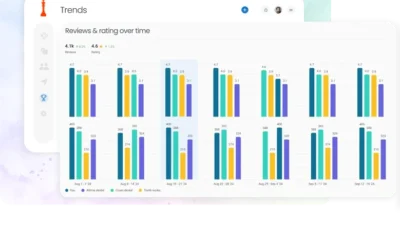
Tracking your business performance over time is essential to understanding your progress and identifying opportunities for improvement. Interactive visuals allow you to monitor key metrics across various periods, such as weeks, months, or quarters, so you can easily identify shifts in trends. Whether it’s a surge in customer engagement or a decline in sales, these visuals help you recognize patterns quickly. More importantly, they give you the insights you need to seize growth opportunities—whether it’s a particular location performing well, a specific demographic engaging with your content, or new market trends you can capitalize on.
Interactive Features for Enhanced Data Exploration
Maverick Insights AI’s Interactive Visuals come with powerful features that let you explore your data in greater depth. You can easily filter information based on location, time frame, demographics, or other custom parameters, giving you the ability to zoom in on the data that’s most relevant to your business. Need to compare your performance across different regions? Or analyze customer feedback trends across multiple platforms? These visuals make it simple to drill down into the exact data you need, all within a few clicks.
Make Smarter Decisions with Real-Time Data
In a competitive business landscape, timing is everything. Interactive visuals provide real-time data updates, allowing you to make decisions based on the most current information available. Whether you’re adjusting your marketing strategy, refining your product offerings, or improving customer service, these visuals ensure that you always have the most up-to-date insights to guide your next steps. With the ability to make timely decisions, you can stay ahead of market shifts, enhance customer experiences, and foster business growth.
Collaborate Effectively Across Teams
Interactive visuals aren’t just useful for individual decision-making—they’re also an excellent tool for fostering collaboration across your teams. By sharing visually engaging reports and dashboards, your teams can align on key objectives, track progress toward goals, and collaborate on strategies to improve performance. This ensures everyone is on the same page and moving toward the same business objectives, making teamwork more efficient and effective. Whether you’re reviewing data with your marketing team, customer support, or senior management, these visuals make it easy to communicate key insights and drive collaborative decision-making.
Highlight Areas for Improvement and Measure Success
Interactive visuals help you not only identify opportunities but also pinpoint areas in need of attention. By comparing metrics over time or across different locations, you can easily spot where your business might be underperforming or where customer satisfaction might be declining. These insights help you prioritize areas for improvement and implement strategies to address those issues. On the flip side, these visuals also allow you to measure the impact of positive changes, whether it’s a successful marketing campaign or improved customer service efforts, ensuring that you’re always measuring progress toward success.
Enhance Your Reporting and Presentations
In addition to guiding internal business decisions, interactive visuals are an excellent way to enhance your reporting and presentations to stakeholders. Instead of presenting dry data in text-heavy reports, you can leverage these visuals to present your data in a more engaging and informative format. This makes it easier for stakeholders to understand key takeaways, track business performance, and see the results of your strategic initiatives, creating more meaningful discussions around the data and facilitating better decision-making at all levels.
Experience Enhanced Data Security and Privacy
While data visualization is essential for improving decision-making, protecting your sensitive business and customer data is just as important. Maverick Insights AI ensures that all interactive visuals and data are displayed with the highest level of security and privacy. You can control who has access to the data and ensure that it is only shared with authorized team members, safeguarding your business information while still enabling quick and efficient decision-making.
Take Control of Your Data, Make Informed Decisions
Interactive visuals empower you to take control of your data by giving you the tools and insights you need to make confident, informed decisions. Whether it’s tracking performance across various metrics, comparing results over time, or uncovering growth opportunities, these visuals simplify the decision-making process and make data analysis a breeze. Say goodbye to spreadsheets full of raw data and hello to dynamic, easy-to-understand visuals that help you unlock your business’s full potential.


